Here’s a scene I keep running into, and I bet you’ve seen a version of it too.
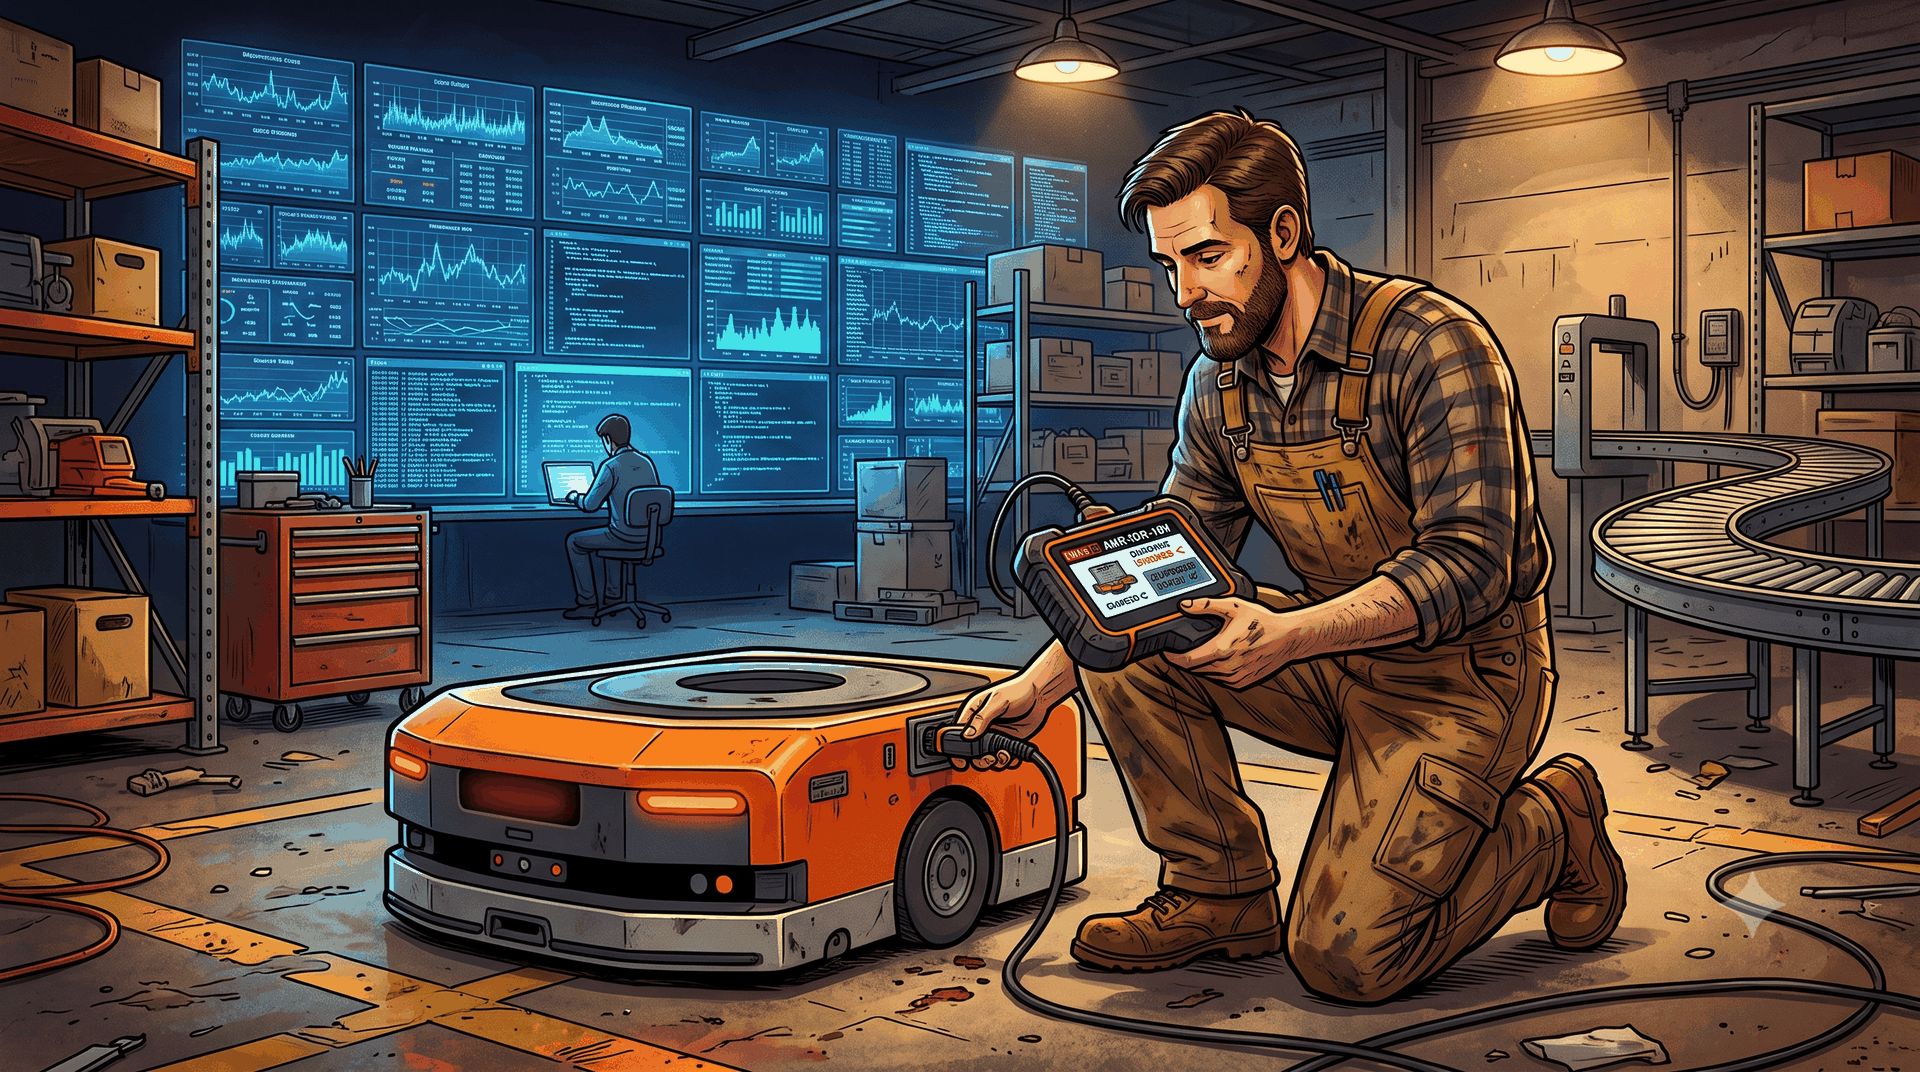
A robot stops in a warehouse. The fleet has dashboards — good ones! Grafana panels, traces, metrics, logs shipped to some index that costs real money every month. The team did their observability homework. And what happens next? Somebody opens a terminal, SSHes into the robot, and starts grepping.
I find this endlessly fascinating. We built all this tooling, and the moment something actually breaks, we’re back to grep -r "ERROR" like it’s 2009. Why?
I’ve been chewing on this for a while now, and I think I finally have the answer: observability and diagnostics are two different disciplines that happen to look similar from a distance. We keep buying the first one and expecting it to do the job of the second.
Two questions, not one
Observability answers the question: what is the system doing? It’s built for an engineer, sitting at a desk, with context in their head, exploring. Traces, metrics, structured logs — these are exploration tools. They are wonderful when you know roughly what you’re looking for.
Diagnostics answers a different question: what is wrong, why, and what do I do about it? And here’s the part that took me embarrassingly long to appreciate — it’s built for the moment when the context is gone. The person standing in front of the broken machine is a technician who has never seen your codebase. Or it’s you, three months later, which is basically the same thing.
A log line is a sentence somebody wrote for themselves at write time. A fault is a data structure designed for a stranger at failure time. Those are not the same artifact, and no amount of log shipping turns one into the other.
The car in your driveway already solved this
This is the part I genuinely love, because the answer has been sitting in the parking lot the whole time.
When your car breaks, the mechanic doesn’t read logs. There are no logs, not really. Instead, the car stores a fault code — a DTC — and here’s the beautiful bit: alongside the code, it stores a freeze frame. Engine RPM, coolant temperature, vehicle speed, throttle position — the state of the world at the exact moment the fault occurred. Captured automatically, kept until someone reads it out.
And faults have a lifecycle. Pending. Confirmed. Healed. A fault that occurred once on a cold Tuesday is different from a fault that fires every four minutes, and the system knows the difference. There’s a standard protocol to query all of this (UDS, and these days its HTTP-speaking successor, SOVD), which means a mechanic in any garage on the planet can plug in a generic tool and get answers from a car they’ve never seen.
Thirty-plus years of this. Deterministic, boring, spectacularly effective. I spent years in automotive and I’ll admit I took it completely for granted — until I started working with robots and discovered that none of it exists there.
ROS 2 didn’t solve it, and not for lack of trying
ROS 2 has a diagnostics stack. There’s a /diagnostics topic, a DiagnosticArray message, diagnostic_updater, diagnostic_aggregator. I want to be fair here: it’s genuinely useful, and a lot of care went into it.
But look at what it actually is: a live status feed. Key-value pairs of strings, published periodically, aggregated into a tree of OK/WARN/ERROR. If you were subscribed at the moment something went wrong — great. If you weren’t? The message is gone. There is no fault memory. No lifecycle. No freeze frame. No standard way to ask a robot “what happened to you last night?” from the outside.
And many people have tried to fill the gap. Record everything with rosbag and dig through it later (now your problem is storage, plus digging). Ship /rosout to Elasticsearch (congratulations, you’ve built observability again). Export to Prometheus, watch in Foxglove — all good tools, and every single one of them answers “what is the system doing?” We keep rebuilding the exploration tool and wondering why the technician in the warehouse still can’t get an answer.
The pattern, once you see it, is everywhere: robotics keeps reinventing observability because that’s what the software world sells, while what a machine standing on a concrete floor actually needs is what the automotive world figured out decades ago.
Someone finally built the missing piece
So imagine my delight when I stumbled over a project that is exactly the transplant I’ve been describing. Full disclosure: it’s not mine, I have no stake in it. I just found it and got that rare feeling of finally, somebody gets it.
ros2_medkit is an open-source (Apache 2.0) diagnostics gateway for ROS 2. It takes the ideas that cars have had for thirty years and gives them to robots: your nodes get organized into a SOVD-style entity tree, and failures become structured faults — a fault code on an entity, with a lifecycle, a history, and a freeze frame of the system state captured at the moment it happened. All of it queryable over a plain REST API. No SSH. No custom tooling on the laptop.
My favorite part is how it gets the data: drop-in bridges. Point them at what your system already emits — /diagnostics, /rosout, aborted actions — and log lines become faults with context. Zero code changes. You can point a container at an already-running robot and be asking it questions a few minutes later. (Fast DDS and CycloneDDS are both baked in, because of course that’s the first thing that would have bitten you.)
And the part that really hooked me: ros2_medkit is the open-source foundation of selfpatch.ai, which takes the same idea across the whole factory floor — ROS 2 robots, PLCs over OPC-UA, automotive ECUs. One diagnostic layer across industries that have never spoken the same language, deterministic fault correlation against past incidents, signed over-the-air fixes with rollback, a human approving every step. On-premise, air-gapped if you need it. That’s the cross-pollination I’ve been waiting years to see: automotive’s hard-won diagnostic discipline, finally leaking into every machine that stands on a factory floor.
How much do I love this idea? Enough that I did the thing I always end up doing when an idea won’t let go of me: I rebuilt it. The taktora-medkit crates are my Rust port of the medkit concept, part of taktora, my execution framework on top of iceoryx2. Same SOVD entity tree, same fault model with freeze frames, same REST contract — ros2_medkit-compatible, so the same tooling talks to both. There is no better way to find out whether an idea is sound than to build it a second time, in another language, on another stack. I can report: the idea survives the port. It’s that good.
Ask better questions
None of this means you should rip out your dashboards. Keep OpenTelemetry. Keep the metrics. Observability is great at what it does.
Just notice which question your tooling answers. “What is the system doing?” is for engineers exploring. “What broke, why, and what do I do now?” is for the moment that actually costs you money — and it deserves its own discipline, its own data structures, and yes, its own fun.
Because that’s the thing I keep coming back to: this problem is fun. It’s freeze frames and fault lifecycles and entity trees — real mechanisms, thirty years of proven ideas, waiting to be brought to machines that badly need them. If that sounds like your kind of fun too, the code is right there. Point it at a robot. Ask it what’s wrong. See what it says.
CRA Isn't New. OT Just Wasn't Listening.
TwinCAT on Apple Silicon